We are Beacon Investment Management, a Registered Investment Advisor in Raleigh, NC. "Empowering people to live more abundant and purposeful lives."
Wednesday, April 18, 2012
Friday, April 13, 2012
"The Art of Winning an Unfair Game"
Today's Brief explores our natural affinity toward speed and power in our investing options. Why is it that we almost universally tend to swing for homeruns when singles and doubles will get the job done?

As you look at the data above, the first thing that might surprise you is just how badly Apple got hit in 2000. Just a moment ago, when you were making your selection, you likely remembered 2000 was a tough time for tech stocks, but that stellar12-year return you heard about, likely helped persuade you to set 2000 aside as an ugly and horrible outlier. But as you look at the numbers more closely, see what a cost to lifestyle that ‘ugly outlier’ inflicted. Your portfolio fell from $1,000,000 in 2000 to $266,430 in just a year.

In
his book Moneyball: The Art of Winning an Unfair Game Michael Lewis told the story of Oakland Athletics’
baseball manager Billy Bean’s success in taking one of the poorest teams in major
league baseball to the top against teams with two and three times their salary
budget. Billy came to believe that on-base percentage
and slugging
percentage were better indicators of offensive success than industry-standard
qualities such as speed and contact with the ball. In other words, simply
getting on base more often, no matter how you do it, is more important than stealing
bases, batting runs in, or batting average.
But
the concept of ‘slugging' it out being superior to ‘speed’ is certainly not new
with Billy Bean or Major League Baseball. Back in 560 BC or so a fellow named
Aesop depicted the theory in his fable The Tortoise and the Hare. You know the
story; the arrogant hare, after ridiculing the slugging tortoise, takes his
challenge to a race. After quickly leaving the tortoise in the dust, the over-confident
hare tires and decides to take a nap only to find later that he has been passed
by the steadily plodding tortoise.
But
who would bet on a tortoise in a race against a hare, except maybe Aesop or the
tortoise? It just doesn’t make any sense. We seem to be naturally drawn to the
speed of the hare, the daring of base stealers, and the power of the big home-run
hitters. In the same way, in our investing, we are attracted to the hottest
mutual funds and stocks. They are so much more appealing than plodding, boring index funds.
So let's have a little race ourselves. If
you could go back to 2000 and pick just one stock, knowing what you know right
now (without further study), which one would it be? I’m guessing Apple would be
top-of-mind for many. Since the beginning of 2000 Apple has generated a
cumulative return of 2,232% or 29.3% annually. A sum of $100,000 invested in
Apple on the last day of 1999 would be worth $2.3 million today.
Now
let’s make this race really interesting. What if you were 65, ready to retire,
and that you could choose to retire here and now, with no knowledge of the future, or you could go
back to January of 2000, with perfect knowledge of how two investment choices
would perform? You have $1 million and want to spend at least $80,000 of it annually. Your choice
consists of keeping your dull index portfolio consisting of 60% stocks and 40%
bonds and cash or Apple. As with Apple’s return of 29.3% you learn that your
portfolio will return 4.9% annually for the next 12 years. Which one will you
choose?
If
you succumbed to temptation and picked the Apple, I’ve got some bad news for
you: in mid-July of 2007 you would receive a phone call from your advisor informing
you that your account was fully depleted. You just got kicked out of paradise.
Alternatively,
if you opted for the ‘tortoise' portfolio, of 60% stock and 40%
bonds, you would have plodded comfortably along, through 2007, 2008, 2009, 2010,
2011, and 2012. As of March 31st of this year, you would still have $197,308.

Data Source: Morningstar
As you look at the data above, the first thing that might surprise you is just how badly Apple got hit in 2000. Just a moment ago, when you were making your selection, you likely remembered 2000 was a tough time for tech stocks, but that stellar12-year return you heard about, likely helped persuade you to set 2000 aside as an ugly and horrible outlier. But as you look at the numbers more closely, see what a cost to lifestyle that ‘ugly outlier’ inflicted. Your portfolio fell from $1,000,000 in 2000 to $266,430 in just a year.
Back to our metaphor; what a costly nap that was for our hare! But
maybe all would not be lost though. The following year’s 64% sprint might just get him
back in the race, but alas, another rest stop for 31.2% would be required. From
there, the race was over. Our hare ugh, Apple would never catch up, even with blistering
hops of 45%, 183%, 157%, and 25% in the years that followed.
The
birds-eye view shows that the race was never really close.

If
you are the New York Yankees with $125 million to throw away every year, then
you can afford some flashy rabbits. But if you more closely identify with the
Oakland A’s on one third that budget, perhaps some steady slugging is the wiser
course.
The
wisdom of Aesop’s Tortoise and Hare has been around for some 2,500 years to guide
the investment practices of those who heeded. But wise investment counsel actually
dates considerably further back. Speaking for God back in 920 BC, King Soloman
wrote “The plans of the diligent lead to profit as surely as haste leads to
poverty.” Proverbs 21:5.
Have
a great weekend.
Friday, April 6, 2012
Good Friday
Jesus Christ was crucified, died, and was buried on the Friday which preceded the original Easter. Why is a day that marks Jesus’ horrible suffering and death on a cross called "good?"
Actually, the term 'good' is unique to the English language. According to Ken Collins, in Germany this day is called Karfreitag. “The Kar part is an obsolete word, the ancestor of the English word ‘care’ in the sense of cares and woes, and it meant mourning. So in German, it is Mourning Friday. And that is what the disciples did on that day—they mourned. They thought all was lost.”
The origin of the name Good Friday, according to some scholars, comes from an Old English synonym (good) for "holy." Others argue it is a corruption of the word "God," in the same way that "Good Bye" comes from the phrase "God be with ye."
Christians call this day “good” because Easter represents the culmination and the victory of Jesus’ “Good News,” or Gospel. Christ’s death is the fulfillment of God’s judgment on sin. Oswald Chambers puts it beautifully: “There is nothing in time or eternity more absolutely certain and irrefutable than what Jesus Christ accomplished on the Cross— He made it possible for the entire human race to be brought back into a right-standing relationship with God.” That is GOOD NEWS for us all!
Have you also wondered about the three days and three nights? There aren’t three days and three nights between Friday and Easter Sunday, so how is this explained? The scriptural reasoning is that the saying is idiomatic. It occurs elsewhere in scripture. Ken Collins notes that Jonah spent three days and three nights in the belly of the whale. But he was swallowed by the fish one day and spit out on the third day (Jonah 1:17—2:10). In order for there to be three days there could only be two nights separating them. Similarly, in Esther 4:16—5:1, there is a fast for ‘three days and three nights’ that begins on the first day and ends on the third day, which means only two nights were involved.
Jesus was buried on Friday, the day of his death, and rose three days later from the dead, breaking forever the bondage of sin over mankind. Chambers says “The heart of salvation is the Cross of Christ. The reason salvation is so easy to obtain is that it cost God so much. The Cross was the place where God and sinful man merged with a tremendous collision and where the way to life was opened. But all the cost and pain of the collision was absorbed by the heart of God.”
Good News and Happy Easter
Friday, March 30, 2012
Your Future Called and it Could Use Your Attention
You have brains in your head and feet in your shoes
You can steer yourself any direction you choose.
You’re on your own and you know what you know
And you are the one who’ll decide where to go.
Dr. Seuss
Mark Twain encourages us to "plan for the future because that is where [we are] going to spend the rest of [our] life.” But that is not what we do. In fact, very few of us set goals and plan (beyond business or job requirements) and fewer still write them down and review them regularly. Many web posts claim only 3% in the latter category, but I have not found sufficient study evidence to provide a number. Let’s just say it’s a very small percent of the population.
So, if almost anyone would agree that planning is beneficial, why do so few of us do it?
We are too busy
The Labor survey demonstrates that we are just too busy living in the moment to look down the road any great distance. For many of us the future is not much more than our next text response or what’s for lunch. If things are good now, why take time to think about possibly working harder on some goal to make them even better? After all, John Lennon implored us to live in the moment; “Life is what happens when you’re busy making other plans.”
The Labor survey demonstrates that we are just too busy living in the moment to look down the road any great distance. For many of us the future is not much more than our next text response or what’s for lunch. If things are good now, why take time to think about possibly working harder on some goal to make them even better? After all, John Lennon implored us to live in the moment; “Life is what happens when you’re busy making other plans.”
Another way to put it is that too many of us are simply not serious about our future. We don’t live as though we had any greater purpose or significance than simply moving to the next thing. Yet with each passing day, we know in our hearts that unless we get serious, we will not accomplish anything of consequence. Who starts to build and does not count the cost? Clearly what is lost for most of us is a healthy balance between living well today and planning for a better tomorrow.
We Don’t Believe
Our own doubts can be powerful disincentives to goal-setting. We’ve carried many of them from our upbringing, childhood to present, we own them. They are so familiar to us they have become a part of us. And if you can’t squash your dreams yourself, tell them to someone who doesn’t value planning or goal-setting and they’ll help you kill them.
Remember Orville and Wilber the bicycle shop owners? They had a dream to change the world by figuring out this flying thing. How many times do you think they heard how ridiculous their dream was from family, friends, customers, and strangers alike? Through it all they were able to shake off their self-doubts and those of virtually everyone around them to accomplish something far greater than their immediate reach, financially, physically, or emotionally. Visit the Smithsonian sometime to see and read their plans. What a fabulous story of planning at its finest. As Dale Carnegie put it, “most of the important things in the world have been accomplished by people who have kept on trying when there seemed to be no hope at all.”
We Fear Failure
Perhaps the greatest obstacle to success in life is the fear of failure. It can paralyze and lock us into routines that are well below our potential. We focus only on the obstacles, the potential failure. Hannah Moore said that “obstacles are those frightful things when you take your eyes off your goals.”
People who fear failure don’t understand that it is a vital and necessary part of success, in fact a prerequisite. Anyone striving to reach his potential must be willing to risk repeated and often costly failures along the way.
Consider the Wright brothers once again. Not long ago I was able to see an extraordinary exhibit of their accomplishments in a large exhibit devoted to them at the Smithsonian. I was absolutely fascinated by their detailed notes and plans. They read like a story of heroic design against an unknown, uncharted abyss we call the atmosphere. It was standard operating procedure for them to take multiple sets of replacement parts to repair their machine crash after crash. But progress was made with each grinding and dusty crackup. Their notes read like ‘failure, failure, re-design, failure, tweak, slight improvement – failure and so on.’ Then on December 17, 1903 all their plans, failures, blood, sweat, and tears culminated in man’s very first controlled, powered and sustained, heavier-than-air human flight.
As far as your financial planning goes with us, our Monte Carlo model ‘lives’ the failures so you don’t have to experience them. We can confidently avoid them leaving nothing to fear, on the financial front anyway.
We Don’t Understand the Importance
Many people, in fact most, grow up with no introduction to the importance of goal-setting or planning. And unless they were introduced along the way, they remain unaware of the true potential. For these folks, stories about the heroes of goal-setting and achievement could well be about people from another planet. They would have no frame of reference even of the concept of planning for a better future.
How Can We Improve? And How Can Beacon Help?
Heidi Grant Halvorson, a Ph.D., motivational psychologist and author of the Harvard Business Review Single Nine Things Successful People Do Differently, addresses the reasons we are successful in reaching some of our goals and not others. She says that even brilliant and highly accomplished people are not good at understanding shy they succeed or fail at goal-setting. Its really quite more than native talent.
Here are Halvorson’s nine things successful people do differently (in quotes) with my thoughts added (in itallics) where we can help.
1. “Get specific. When you set a goal, try to be as specific as possible. Knowing exactly what you want to achieve keeps you motivated until you get there. Also, think about the specific actions that need to be taken to reach your goal.” Every financial goal you value is front-and-center in and fully integrated into our planning and management process.
2. “Seize the moment to act on your goals. Given busy schedules and multiple goals we routinely miss opportunities to act on a goal because we simply fail to notice them. Decide when and where you will take each action you want to take, in advance. Studies show that this kind of planning will help your brain to detect and seize the opportunity when it arises, increasing your chances of success by roughly 300%.” This is the strength of our process. We alert you the opportunities present themselves to improve a goal or goals and to make necessary adjustments if confidence slips.
3. “Know exactly how far you have left to go. Check your progress frequently — weekly, or even daily, depending on the goal.” Through Wealthcare we monitor your progress continually. You make adjustments when we talk or meet. Your plan is only as good as you make it.
4. “Be a realistic optimist. When you are setting a goal, by all means engage in lots of positive thinking about how likely you are to achieve it. Believing in your ability to succeed is enormously helpful for creating and sustaining your motivation. But whatever you do, don't underestimate how difficult it will be to reach your goal. Most goals worth achieving require time, planning, effort, and persistence.” Measuring difficulty or uncertainty is the key benefit of our continuing Monte Carlo stress testing. We rigorously ‘live’ your life plan through all kinds of realities including the wildly good and the horrendously horrible.
5. “Focus on getting better, rather than being good. Believing you have the ability to reach your goals is important, but so is believing you can get the ability. Many of us believe that our intelligence, our personality, and our physical aptitudes are fixed — that no matter what we do, we won't improve. As a result, we focus on goals that are all about proving ourselves, rather than developing and acquiring new skills.” Every time we meet your plan improves.
6. “Have grit. Grit is a willingness to commit to long-term goals, and to persist in the face of difficulty. Studies show that gritty people obtain more education in their lifetime, and earn higher college GPAs. Grit predicts which cadets will stick out their first grueling year at West Point.” You have grit and we do too. Together, we’ll make your plan and your life even better.
7. “Build your willpower muscle. Your self-control "muscle" is just like the other muscles in your body — when it doesn't get much exercise, it becomes weaker over time. But when you give it regular workouts by putting it to good use, it will grow stronger and stronger, and better able to help you successfully reach your goals.”
8. Don't tempt fate. No matter how strong your willpower muscle becomes, it's important to always respect the fact that it is limited, and if you overtax it you will temporarily run out of steam. Successful people know not to make reaching a goal harder than it already is. We have decades of experience working with clients through all kinds of markets. If your willpower muscle becomes overtaxed, lean on us.
9. Focus on what you will do, not what you won't do. If you want to change your ways, ask yourself, What will I do instead? We will help you confidently improve your life.
That's it for now. Hope you have a great weekend and consider "Following your dreams, they know the way."
Friday, March 23, 2012
Confessions of an Active Manager
As I look back to the early years of my career as a financial advisor, I recall being driven by three powerful and distinct motivating forces. The first was was necessity. With a wife and three children completely dependent on my commissions, success was not a dream or a goal, it was a necessity. But it was alright, I was also strongly motivated by youthful idealism. Success would come because I was devoted to doing a great job for my clients.


The third powerful motivator was a competitive nature. In fact all the brokers I knew seemed to posess similar characteristics. Our employers understood our motivations very well and were quite intentional about the kind of people they hired. They were expert at using these motivators to great advantage, both for themselves and for us.
The numbers game of sending out so many mailers, followed by so many telephone calls, followed by so many in-person meetings led to so many new clients. It became monotonous at times, but I remained motivated out of need, idealism, and competition. The last, competition was almost constantly fed, by an uninterrupted stream of sales contests.
There were contests for selling limited partnerships of oil & gas, real estate development and apartments and investment tax credits. There were even low income apartment deals designed specifically to lose money for our wealthy clients’ tax write-offs. The top tax bracket was 70% then. There were mutual fund wholesalers in our offices constantly and each one had an incredible promotional incentive trip to some exotic locale. One had to wonder how the company could afford such extravagance and still make any money for the target of their funds (were we the target or were our clients the target?).
After a brief stint with the partnerships and funds, I gravitated toward individual securities (particularly stocks) and managed money (particularly growth). I moved most of my clients into my firm’s portfolio management platform which worked pretty well for a while, but I quickly found myself apologizing or explaining moves that I would not have made myself. I became convinced I could do a better job for my clients. What’s more there would be no one with which to share the credit or the blame. That thought had a strong appeal to my competitive nature.
Inspired by great managers of the time like Warren Buffett, Peter Lynch, and John Neff, I read extensively and trained myself and then received formal training at my subsequent firm, Wheat First Securities. My foray into full-time discretionary management coincided with the early days of the Information Age. As an early technology adopter of PCs and the requisite software to make my job easier, I was strongly convinced of the powerful wave that was to sweep our economy, well in advance of the average investor, or money manager for that matter. I had an advantage that Peter Lynch called buying what you understand. Peter believed that individual investors had inherent advantages over large institutions because the large firms would not or could not invest in smaller companies because the value of the company was too small to make a meaningful impact on their assets, or because they were not yet on analysts’ and fund buyers’ radar. As an early adopter of technology, it became my investing expertise.
As the Information Age rolled along, I became fascinated with the growing wave of “disruptive destruction” where older technologies were being replaced by new ones. It seemed the cycles of destruction were becoming shorter and shorter at an exponential rate. Even the traditional rules of investing were being thrown out by many experts. The old value metrics seemed ill-suited to meet the light-speed requirements of the new “Information Age.”
As our returns and success compounded during the 90’s, our clients began to adjust their lifestyles in remarkable ways and we could not have been happier for them (or ourselves). Common were phone calls from ecstatic clients thanking us that they could put in a pool, re-decorate the house, buy a sailboat, or a Porsche - for cash!, or take that pan-European trip with the whole extended family. Some even took extended sabbaticals to spend their new-found treasure. Prospective clients were waiting in line to sign with us, enthusiastically recommended by our clients for our money-making abilities.
Our aggressive growth model attracted the most attention. From March 1990 through March 2000 the model generated a compound return of 26% per year for clients. Over those 52 quarters returns were as high as 59% in a quarter! For thirty five quarters or two thirds of the time, clients received positive return reports from us. And more than half of them were above the 30-year averages for stocks at the time which was 12%.
Of course there were some big losers too. The worst quarter saw a decline of 57% and seven quarters saw losses of greater than 10% (40% annualized). It was interesting how huge gains made people more accepting of huge losses, but the real tests would come.
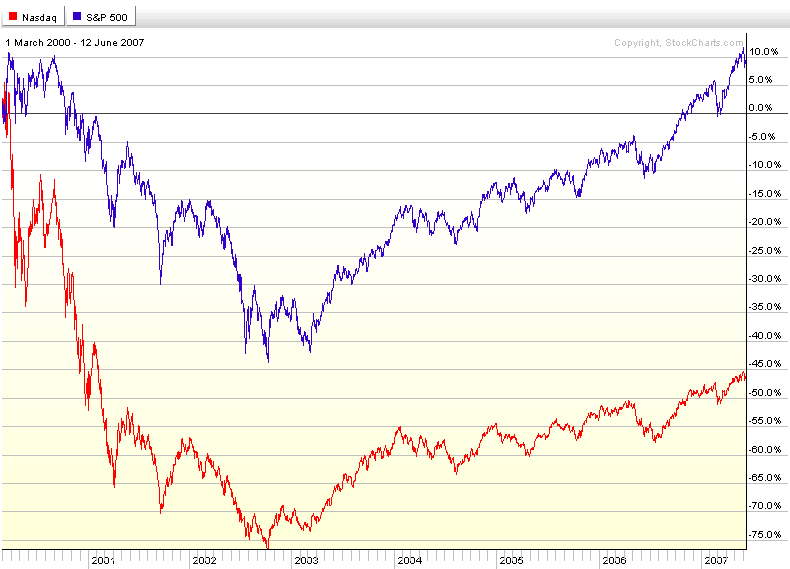
In March of 2000 the Internet Bubble exploded sending stocks tumbling. The NASDAQ, home of most technology stocks at the time fell 50% by the end of 2000. It would fall another 25% for a total of 76% to its bottom reached October of 2002. The S&P fell 43% before it bottomed the same time. Of course, in addition to the Internet crash, there were other ‘disruptions’ such as 911, war with Iraq, accounting scandals and Enron.
Needless to say, these events coupled with huge mounting losses took their toll on our client base. The new clients, the ones we refer to in the industry as “hot money clients” (those who chase top returns) were the first to leave. Then some of our older clients began to leave convinced we would not recover their losses. While we added significant diversification, moving away from technology, our portfolios continued to decline with the markets. Growth stocks were dead and value stocks were in.
During this time Alan Greenspan, Chairman of the Federal Reserve took interest rates to record lows and began pumping money into the economy to replace the billions that had evaporated in the stock market. The next wave of funds leaving came when low rates began a bull market in real estate – and the next bubble began to inflate. My argument that stocks were cheap and would come back with far better returns than real estate carried little weight.
While my clients had done better than the benchmarks we used to measure their performance and they had more money than they would have had if they invested themselves, they were still leaving, unhappy. Even though I had accomplished my objectives of beating my benchmarks, I had somehow fallen short of meeting the expectations of my clients.
Soon after reaching this stark realization, I had a Damascus road experience. It came through three close friends. The first was a client who left saying she was unhappy, not so much with her performance, but that we never talked about what she wanted to do with her money.
The second (same day) came when a good friend, with whom I had started my career, showed me some software he was using. I was fascinated, particularly because it put the client squarely in the center of the process.
Later that same day I received a phone call from Dave Loeper, an old friend and mentor from my Wheat First days and founder of a company I had invested in when he and I had left Wheat six years earlier. His company was known as Financeware. Dave, was calling regarding a deadline to get signatures from his angel investors.
Dave would spend the next hour and a half (time he really didn’t have) converting me from a performance manager to a wealth manager. He asked me a couple of questions that still resonate with me today. “Sam, what value do you bring to your clients?” My answer continued to belie acceptance of his assertions when I said, “I deliver portfolio returns to my clients that are superior to those they can get on their own or with indexes.” He then asked “can you guarantee that?” When I responded that obviously I could not, he asked one more time: “What value do you provide to your clients?”
In that moment it became clear that my clients deserved better than a performance-driven value proposition that is truly no more than a hope for success. I spent the next several months learning as much as I could about Financeware’s program known as Wealthcare. We converted our entire business model from a portfolio focus to a client focus. Conversations with clients became incredibly authentic. It is not an exaggeration to say that I learned more about my clients in the first hour of an initial Wealthcare plan meeting than I had learned in the 5, 10, or 15 years of managing their assets.
Validation that we had made the right choice came quickly. Client plans revealed significant opportunities that had been ignored by our portfolio/return-centric approach. We realized dramatic improvement in the goals our clients valued without sacrificing their current lifestyles. It became clear that the very methods I was using before to create opportunity for my clients was in fact creating uncertainty that hid or diminished them. For instance, in almost every case, we found that our clients were taking more risk than was required to meet or exceed their goals. As a result, our overall portfolio risk as a firm dropped substantially.

As you look at the graph above you can see there was a second drop of greater proportion in the S&P 500 index (in blue) and a much lower one in the NASDAQ (in red) in 2008 and 2009. Most of the nation’s banks and financial companies reside in the S&P 500. As they were hit the worst, the NASDAQ did comparatively better this time around.
So how did we do? We are focused on confidently meeting clients’ goals with sufficient wealth, not return, so graphics don’t tell the full story. Perhaps the greatest difference between 2000 and 2008 came in our telephone traffic. It pains me to think back to 2000 and the many panicked calls I fielded with little more than “stay the course, it will come back” for comfort.
In 2008/2009 our phones didn’t ring with the frenzied calls of 2000. Conversations were mostly prompted by us as we doubled and tripled our efforts to stay in touch through challenging times. When our clients asked how ‘we’ were doing, we offered them substantive information from their latest stress tests which showed they could be confident of meeting or exceeding their goals, despite market declines. It helped significantly that most had experienced significantly less volatility than the 37% declines of the S&P 500. In fact most (86%), required no changes to their plans as a result of the declines.
Today, with six years of Wealthcare experience for more than 75 families, I can happily say that our clients are empowered to live more abundant and purposeful lives as a result of our dramatic change in course. We and our clients no longer take life as it comes, we design lives with purpose.
Friday, March 16, 2012
Confidence
What comes to mind when you hear the word confidence? You might think about the assurance of your own ability to accomplish a task or to succeed in some endeavor, great or small. You might also consider it as faith in somebody else; that they will do right or act in a trustworthy manner. Confidence in this light can also be associated with things that act in a predictable or reliable manner. It can mean a secret shared and it can describe the relationship of trust that exists to make sharing the secret possible.
One of the great fascinations during my thirty years plus in this industry has been observing how fragile and fleeting confidence can be in most every sense of the word - especially as it applies to self and to others. When things are going well and markets are rising, self-confidence reigns. Confidence in others, such as fund managers, is strong too, but it is quite fickle, landing on whomever produces the best results. And the faster markets rise, the shorter the duration that confidence remains in one place.

So how do we gain any confidence from all these lines and uncertainty? The graph clearly demonstrates how vulnerable to uncertainty one is if historical market returns are his only guide to financial confidence; he can only react to what has happened. We take a proactive approach. With this tool, we can measure the uncertainty our clients will experience as they demand from the markets the wealth required to accomplish or exceed their goals.
Notice that most of the lines end above zero. In fact, 830 of them representing virtual lives lived experienced market returns sufficient to meet or exceed our couple’s needs for $65,000 annual spending, adjusted for inflation. Remember, we used a $2 million portfolio (60%/40%) that would be drawn down to zero. Based on the analysis then, our couple can be 83% confident of meeting or exceeding their goals.
But confidence is fleeting, you might say. What happens in the real world when a 2008 comes crashing in and the S&P drops 38%? Let’s say our couple began a relationship with us December 31, 2007. During 2008 our Balanced model (60%/40%) lost 19.7% so our couple’s portfolio would be down to $1,541,000 after taking their $65,000 withdrawal for income. Certainly, that drop might rattle anyone who has nothing more than CNBC or the hollow promise that 'it will come back in time' on which to base his confidence.
During our hypothetical December client meeting, we informed our clients that there was a 17.3% chance of their portfolio becomming under-funded in its first year due to market volatility. In wealth terms that translated to $1,436,072. As their portfolio stood at $1,541,000, the couple's confidence remained above our comfort threshold of 75% so no portfolio or spending changes were required.

(C) Wealthcare Capital Management, Inc.
The plan report that we presented our clients would have included a lifetime snapshot of where their investment portfolio needed to be in today’s dollars for each of their remaining years in order to provide sufficient confidence of meeting or exceeding their income goals.

(C) Wealthcare Capital Management, Inc.
Look again at the table entitled "Chance of Falling Outside the Comfort Zone." It indicates that just in the first year, there is a 41.6% chance our couple will be outside what we consider an acceptable range of confidence. Because of this broad range of potential outcomes in a relatively short period of time we continually stress test our clients' plans against new information to indentify opportunities or risks when their plans become over- or under-funded, respectively. Without a tool like this, determining life-plan confidence is nothing more than guesswork and guesswork is not effective life planning.
Have a nice weekend.
One of the great fascinations during my thirty years plus in this industry has been observing how fragile and fleeting confidence can be in most every sense of the word - especially as it applies to self and to others. When things are going well and markets are rising, self-confidence reigns. Confidence in others, such as fund managers, is strong too, but it is quite fickle, landing on whomever produces the best results. And the faster markets rise, the shorter the duration that confidence remains in one place.
When the tide turns and markets begin falling, and doom and gloom replace the good news nearly overnight, self-confidence begins to fade for the stalwarts, and it evaporates like water on a hot skillet for the rest. They begin heading for the exits as fast as they can, with little regard for anything but getting into the relative safety of cash. This reaction is an understandable one. When there is nothing more than price to gauge confidence, its easy to understand how a sharp drop can elicit fear.
Others, instead of heading for the exits will choose to ‘hunker down’ and ride it out even though confidence in their managers is severely shaken, or even broken. Here is a fascinating phenomenon where people make a conscious decision to stick with managers in whom they have lost all confidence, yet still believe they are better off with them than leaving them. In other words, they have lost confidence in their own ability to choose better managers or more strangely, their need for continuity and consistency ironically supercedes their need for confidence.
There is another definition of confidence that we believe shines like a bright beacon for anyone struggling with uncertainty regarding his or her financial goals. It is that of statistical confidence. We use sophisticated probabilities analysis referred to by many as Monte Carlo analysis to provide confidence for our clients. But the process is complicated. You may not be completely clear on how it works and you might resaonably wonder if you can have confidence in the statistical results it produces.
Our process begins with a database of actual historical market returns (stock and Treasury) and statistically possible returns. As Dave Loeper (designer of our system) points out, we are “able to measure not only the uncertainty of historical returns but also potential returns. This additional step [of including possible returns] helps us make sure we are not ignoring the chance that we have not yet seen the worst (or the best) of what the markets might produce.
So while we cannot predict the future of markets and how they will impact our client’s lives, we can measure the uncertainty of our client’s plan. The system does this by ‘living’ our client’s life plan (cash flow amounts and timing) virtually through all kinds of markets and it does it for 1,000 ‘lifetimes.’ The computer randomly draws market returns and calculates the impact that distinct return has on our client’s wealth relative to his cash flows, one year at a time for every year of his life and then it does it all over again 999 more times. The purpose is to gain an understanding of how confident we can be that our client will exceed his goals considering the uncertainty of market returns, including the very worst of them. With these numerous trials, our client ends up with many more outcomes than the one he was planning for; in other words, we've modeled the uncertainty of the future.
The figure below represents the potential outcomes for a couple living out a 32-year retirement on $65,000 annually (adj. for inflation without Social Security to keep it simple) using a $2 million portfolio (60% stocks, 40% US Treasuries, and cash). Each colored line represents a 10th percentile (there are 100 virtual lifetimes between each line). While the chances for any one of the outcomes to occur are equal, notice how wide the range of potential outcomes is on the right-hand side of the graph. The analysis suggests our couple could end their lives $3.1 million in debt or they could just as likely die with $12.1 million in wealth; and there are 998 additional possibilities in between.

(C) Wealthcare Capital Management, Inc.
So how do we gain any confidence from all these lines and uncertainty? The graph clearly demonstrates how vulnerable to uncertainty one is if historical market returns are his only guide to financial confidence; he can only react to what has happened. We take a proactive approach. With this tool, we can measure the uncertainty our clients will experience as they demand from the markets the wealth required to accomplish or exceed their goals.
Notice that most of the lines end above zero. In fact, 830 of them representing virtual lives lived experienced market returns sufficient to meet or exceed our couple’s needs for $65,000 annual spending, adjusted for inflation. Remember, we used a $2 million portfolio (60%/40%) that would be drawn down to zero. Based on the analysis then, our couple can be 83% confident of meeting or exceeding their goals.
But confidence is fleeting, you might say. What happens in the real world when a 2008 comes crashing in and the S&P drops 38%? Let’s say our couple began a relationship with us December 31, 2007. During 2008 our Balanced model (60%/40%) lost 19.7% so our couple’s portfolio would be down to $1,541,000 after taking their $65,000 withdrawal for income. Certainly, that drop might rattle anyone who has nothing more than CNBC or the hollow promise that 'it will come back in time' on which to base his confidence.
During our hypothetical December client meeting, we informed our clients that there was a 17.3% chance of their portfolio becomming under-funded in its first year due to market volatility. In wealth terms that translated to $1,436,072. As their portfolio stood at $1,541,000, the couple's confidence remained above our comfort threshold of 75% so no portfolio or spending changes were required.

The plan report that we presented our clients would have included a lifetime snapshot of where their investment portfolio needed to be in today’s dollars for each of their remaining years in order to provide sufficient confidence of meeting or exceeding their income goals.
A picture of confidence is worth a thousand virtual lives !

Look again at the table entitled "Chance of Falling Outside the Comfort Zone." It indicates that just in the first year, there is a 41.6% chance our couple will be outside what we consider an acceptable range of confidence. Because of this broad range of potential outcomes in a relatively short period of time we continually stress test our clients' plans against new information to indentify opportunities or risks when their plans become over- or under-funded, respectively. Without a tool like this, determining life-plan confidence is nothing more than guesswork and guesswork is not effective life planning.
Have a nice weekend.
Friday, March 9, 2012
Boomers Take Note
The week’s economic numbers continued their trend toward improvement with manufacturing store sales, consumer confidence, and jobs growth all moving ahead. Even Greece looks to end the week on a strong note as arm-twisting forced enough bondholders to swallow losses of more than 100 billion euros ($132 billion) and allow the beleaguered country to move forward with its next phase of debt re-structuring.
Jobs growth continued at a reasonably healthy pace in February, according to the government. The gain of 227,000 jobs followed gains of 284,000 in January and 223,000 in December. Jobs were produced primarily in the services industries of the private sector. By industry, job gains were strongest in professional and business services, health care and social assistance, and leisure and hospitality, according to Econoday. Average hourly earnings rose a modest 0.1% in February, following a 0.1% gain the month before. The average workweek for all workers in February was unchanged at 34.5 hours. According to the household survey, the unemployment rate remained steady at 8.3% as the pool of available workers rose as fast as new jobs were created.
Consumer confidence is on the rise as more Americans said the economy was improving, according to the Bloomberg Consumer Comfort Index. The index rose to a minus 36.7 in the period ended March 4th, the highest since April 2008 and up from minus 38.8 in the prior period. The gauge on the state of the economy reached a one-year high while the buying-climate measure climbed to a level last exceeded in December 2009. Joe Brusuelas, a senior economist at Bloomberg said consumers are much more comfortable about their own personal financial situations, which is largely negating the recent rise in gasoline prices.” But he also noted index remains at the low end of its historical range.
Consumers took their improved moods shopping last week according to Goldman Sachs and Redbook. Goldman’s weekly same-store sales index rose 1.3% in the week ended March 3rd, while Redbook’s index saw a 3.0% rise of year-on-year same store sales ended March 2nd. This rate compared to a 3.4% gain the prior week. Redbook sees stronger sales ahead for the month ahead.
The ISM reported that its non-manufacturing index rose 0.5% to 57.3. Econoday says the composite may understate underlying strength in the bulk of the nation's economy where order levels are building with new orders up nearly two points to a very strong 61.2 vs. January's already very strong 59.4. The index is comprised of agriculture, mining, construction, transportation, communications, wholesale trade and retail trade companies.
The manufacturing sector cooled modestly as factory orders fell back 1.0% following very strong gains in the prior months of 1.4% and of 2.2%. Weakness was centered in durable goods orders which fell 3.7%. Orders for non-durable goods, which always reflect price swings in commodities especially oil, rose 1.3%.
Boomers Take Note
An article this week caught my attention as an example of how terrible financial advice can be taken as sound by it's association with the presenter; in this case the Wall Street Journal. The article was titled Testing the 4%-a-Year Retirement Rule and features Bill Bengen, a financial planner in Southern California who developed the 4% rule. The following description of his rule is excerpted from the article: “In a study published in 1994, he said that if retirees withdrew 4% of their nest egg in the first year, and then increased the dollar amount by the inflation rate every year, their savings would easily last 30 years. He assumed that the portfolio was held in a tax-deferred account and was evenly split between large-company stocks and U.S. Treasury bonds. In a subsequent study, Mr. Bengen added U.S. small-company stocks to the mix, which increased the portfolio's volatility and potential return. To adjust for this, he revised the withdrawal rule to 4.5%.”
The first problem is with the article itself. There was no testing to be found. The author merely points out that as stocks have become more volatile, many wonder whether Mr. Bengen's rule still holds. The answer?: Well, Mr. Bengen says he thinks it does. However, he says the next five years could be crucial, particularly for individuals who retired in 2000 and have experienced two major stock-market downturns since then. He expects stock returns to be low for a while; if that is coupled with high inflation rates, "then retirees have a big problem," he says.
In my view Mr. Bengen’s ‘rule’ has several problems. While it seemingly addresses inflation, it ignores capital market uncertainty. Uncertain returns (portfolio values) mean that spendable income (4.5% of portfolio plus inflation) will swing wildly from one year to the next. My experience is that people really don’t like their income to swing.
Take for example a couple with a million dollars to spend over their remaining 30-year retirement. Mr. Bergen’s examples use a deferred account invested in a balanced portfolio (60% equities and 40% fixed) so we will too. Using our Monte Carlo system to live our couple’s lives virtually 1,000 times through randomly generated capital market returns (against an allocation of 60% equities and 40% fixed) we find that their income would range significantly depending upon the kinds of market returns they would experience.
Lowest | Highest | |
Income | Income | |
25th Percentile - Good Markets | $34,376 | $65,038 |
50th Percentile - Average | $36,335 | $66,382 |
75th Percentile - Poor Markets | $30,396 | $49,012 |
In today's dollars |
Here’s how the cash flows look under these three lifetime scenarios.


The picture above illustrates why so many throw their hands up and buy annuities, which are basically contracts which pay the insurance company to give them back their own money.
There’s another huge problem with Mr. Bengen’s rule of 4.5%. Look below at all the money our couple would have left over at their deaths; money that they may have wanted to use during their lives. Even at the 75th percentile, the most pessimistic of our examples above, the couple left $783,832 in the bank, unspent. OK, they may have heirs to whom the money might have gone. But shouldn’t the donors get the chance say how much?

Here’s a better way.
Take our same couple, assuming the same portfolio and risk allocation of 60% stocks and 40% bonds. But this time, let’s suggest that instead of accepting a lifestyle dictated by their returns let’s give them the opportunity to do some dictating themselves. We would ask them what level of spending might be ideal as well as what would minimally suffice if other more important goals required it. In this case our only other goal is to leave something for the kids.
Our couple tells usthat it would be ideal for them to spend $45,000 (after-tax) annually (adj. for inflation) for the rest of their retired lives. If necessary their spending could be reduced to $40,000. They would ideally like to leave their children $100,000, but not less than $50,000.
We inform our couple that they could accomplish both goals at their ideals and have an 81% confidence of exceeding both goals. Our objective is to maintain, to the extent possible, our clients’ income and estate goals through actual market turbulence and the uncertainty of future markets. By continually measuring uncertainty in our clients’ plan we can make adjustments to their spending, estate, and portfolio risk (allocation) according to their priorities to maintain a comfortable level of confidence.

The table above illustrates the broad range of potential outcomes for a $1 million portfolio delivering an annual after-tax income level of $45,000 (adj for inflation) and ending with $100,000. There is a 75% chance the portfolio will be worth more than $300,000 at death and a 25% chance that it will exceed $2.1 million. It is a picture of why our couple needs professional assistance in managing the uncertainty ahead of them and why a simple 4.5% rule of thumb simply won’t do.
Have a nice weekend.
Friday, March 2, 2012
Tick . . . Tock . . . Tick . . . Tock
It is now two and a half years since the Great Recession officially ended. The 18-month downturn was the longest and most severe since World War II according to the National Bureau of Economic Research, a private, nonprofit research group which officially calls the beginning and ends of recessions. But things are getting better you say. Why bring up the ugly past?
Unemployment is getting better, but at rates not even approaching previous recoveries. And the rates of growth in consumer spending are slowing. Remember, rising employment doesn’t bring more spending, it’s the other way around. Businesses don’t hire until they begin selling more stuff that they will have to replace. And they are not. The rise in employment could well roll over just like that red line below in GDP.

Since the Great Recession started, the US government has invested/spent/squandered (depending upon your viewpoint) an unprecidented $4.5 trillion more than it has realized in taxes and TARP paybacks. That’s just on the fiscal side. On the monetary side, the Fed is giving it away for free (when inflation is considered) and promises to do so for another two years.
Since the Great Recession was officially declared ended in June of 2009 the S&P has rallied almost 50% (not including dividends), but there’s not much celebrating there either. The average still remains 7% below the level it occupied when the recession officially began. Adding to the conumdrum is the fact that Treasuries (as measured by the Barclay’s 7-10 year index), which should have been clobbered as stocks rose 50%, are 16% higher (not including interest) since the recession ended.
Bond buyers typically look much further into the future than do stock buyers. This is because they are making a relativly long-term commitment to a steady stream of income payments that will not change as prices rise or fall. Inflation is their biggest concern, and strong economies are much more apt to gnerate rising prices than weak ones.
In trillions of dollars

Some economic data have indeed shown improvements, particularly of late. Manufacturing has been a steady stalwart of the recovery. Exports have persisted strongly for months, while the much touted automobile industry has made a ‘remarkable’ turnaround domestically. GM regained the lead over Toyota for goodness sake.
Yesterday the Commerce Department announced that it revised fourth quarter GDP growth up to 3.0% (GDP is a measure of the nation’s economic output) from an initial estimate of 2.8%. This figure compares to .4% 1.3% and 1.8% for the prior three quarters of 2011. So the near-term trend looks pretty good, but look a little deeper. Unemployment is getting better, but at rates not even approaching previous recoveries. And the rates of growth in consumer spending are slowing. Remember, rising employment doesn’t bring more spending, it’s the other way around. Businesses don’t hire until they begin selling more stuff that they will have to replace. And they are not. The rise in employment could well roll over just like that red line below in GDP.

Since the Great Recession started, the US government has invested/spent/squandered (depending upon your viewpoint) an unprecidented $4.5 trillion more than it has realized in taxes and TARP paybacks. That’s just on the fiscal side. On the monetary side, the Fed is giving it away for free (when inflation is considered) and promises to do so for another two years.
Since the Great Recession was officially declared ended in June of 2009 the S&P has rallied almost 50% (not including dividends), but there’s not much celebrating there either. The average still remains 7% below the level it occupied when the recession officially began. Adding to the conumdrum is the fact that Treasuries (as measured by the Barclay’s 7-10 year index), which should have been clobbered as stocks rose 50%, are 16% higher (not including interest) since the recession ended.
Bond buyers typically look much further into the future than do stock buyers. This is because they are making a relativly long-term commitment to a steady stream of income payments that will not change as prices rise or fall. Inflation is their biggest concern, and strong economies are much more apt to gnerate rising prices than weak ones.
Stock investors, on the other hand, invest with the hopes that companies will increase their earnings at the expense of their competitors or more often when the broad economy grows. It could well be that stock investors are beginning to question whether prices may already reflect the potential ahead. This week State Street announced that confidence among institutional investors may be breaking down. Their monthly index fell to a weak 86.5 in February which reflects an easing in demand for equities. State Street said that the North American sample shows the greatest weakness, at 80.5, representing its lowest reading in more than three years. Europe is at 95.2 and Asia is at 96.3. A reading below 100 indicates demand for safety (bonds – Treasuries in essence).
Now, back to the question of why this recovery seems to be so anemic given the gigantic stimulus measures thrown at it. The usual suspects like Europe, high energy and food costs, high unemployment, and falling home prices seem daunting, but our economy has tossed aside hurdles more challenging than these with impressive growth in previous recoveries. Could it possibly be that a significant majority of our collective economy have become like bond buyers? Are more of us coming to the conclusion that the stimulus is no longer nourishing, but poisionous, that the deficits and mounting debt will eventually swamp our productive capacity or will?Since December of 2009 our government has spent $4.5 trillion that’s $4,500,000,000,000 more than it brought in. This number represents a full third of the US economy and that’s on top of the $9.1 trillion government collected and spent during the same period. US Government debt now stands at $15.4 trillion which is very close to 100% of the nation's total economic output. Projections take it to 108% in 2014. The last time debt was this high relative to our output we were at war on two fronts with Nazi Germany and Imperial Japan. As a country we were perhaps more united than any time in our history, including our fight for independence. Today its hard to imagine we were ever more divided and still at peace within our borders.
Some like to to blame the nation’s financial problems on presidents. After all, they are the guys who submit the spending budgets. But if you like to speak from a political point of view, the numbers below don’t provide much moral high ground for either party. They do however suggest a trend. Obama Deficits | ||
% Spending | ||
FY 2012 | 1,327 | 35% |
FY 2011 | 1,300 | 36% |
FY 2010 | 1,293 | 37% |
Bush Deficits | ||
% Spending | ||
FY 2009 | 1,413 | 40% |
FY 2008 | 459 | 15% |
FY 2007 | 161 | 6% |
In trillions of dollars
Others realize that it is the Congress and the “Washington Machine” that are to blame. That’s where the money is appropriated and spent, and overspent. In fact the Congress has increased the US debt limit 74 times since 2001. Do they even know what 'budget' means?

And there are a very few who remember that we are a democracy and that “WE THE PEOPLE” are ultimately to blame for the mess in which we find ourselves trapped. Out of abject neglect we have stood by for decades and allowed an elected few to squander the greatest natural and material blessings ever bestowed on a single nation. As a result our very future is now nearly 'underwater,’ buried in a rising sea of debt.
In the language of an investor, the US's next quarter ends this November with few signs of improvement. Analysts estimate that profits and growth are expected to be sub-optimal for years, possibly decades to come due to an inexperienced, self-serving management, a lousy balance sheet (near-bankrupt in many industries), an aging physical plant, an outdated, inefficient corporate bureaucracy and culture, inept training, little innovation, and union incalcitrance. If and only if the shareholders can somehow replace the bad management at all levels with more competent, visionary leaders, then there is a chance this giant enterprise may once again become that "shining city on a hill" as once proudly proclaimed by a former CEO. If not, maybe the bonds will prove a better way to go. Their meager 2% returns may prove safe from inflation or deflation as there will be little chance that the US economy will grow fast enough to erode spending power.
Subscribe to:
Posts (Atom)